Analysis and Implementation of Multidimensional Data Visualization Methods in Large-Scale Power Internet of Things
Published in International Conference on Broadband Communications, Networks and Systems (BroadNets), 2019
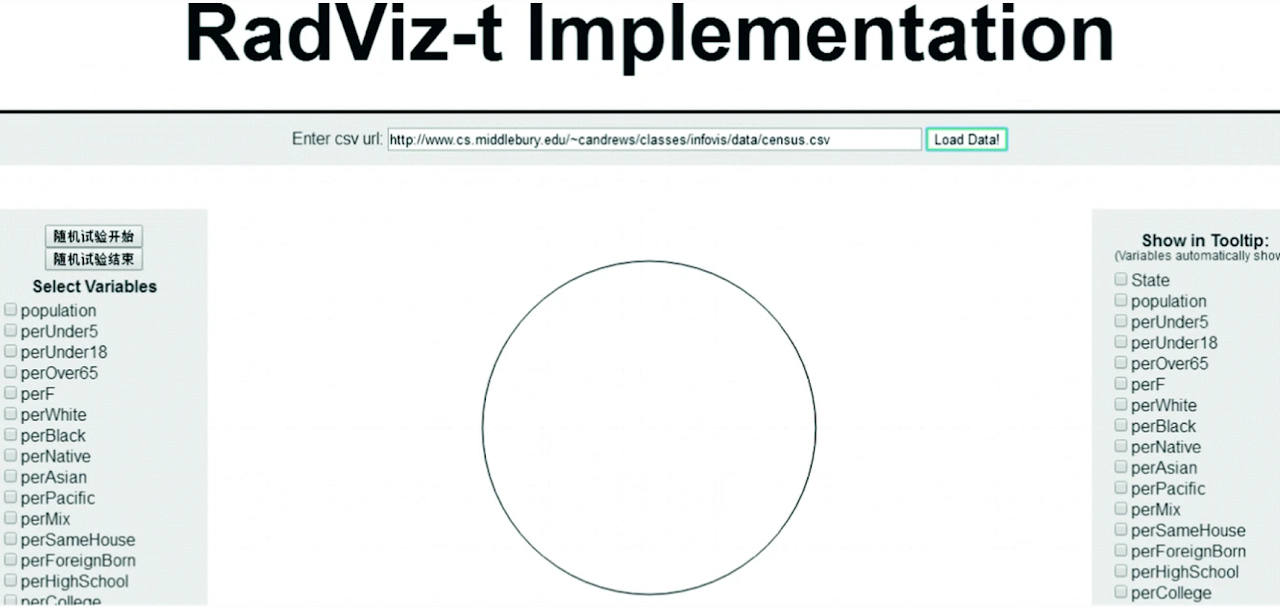
Summary: We implement and assess RadViz-t style visual analytics for high-dimensional data in large-scale power IoT scenarios.
Abstract
In the large-scale power Internet of things, a large amount of data is generated due to its diversity. Data visualization technology is very important for people to capture the mathematical characteristics, rules and knowledge of data. People tend to get limited and less valuable information directly form large data when rely only on human-being’s cognition. Therefore, people need new means and technologies to help display these data more intuitively and effectively. Data visualization mainly aims at conveying and communicating information clearly and effectively in term of graphical display, which can make data more human-readable and intuitive. Multidimensional data visualization refers to the methods to project multidimensional data to two-dimensional plane. It has important applications in exploratory data analysis, and verification of clustering or classification problems. This paper mainly studies the data visualization algorithm and technology in large-scale power Internet of things. Specifically, the traditional Radviz algorithm is selected and improved. The improved radviz-t algorithm is designed and implemented, and the unknown information of data transmission is obtained by analyzing its visualization effect. Finally, the methods used to study fault detection ability of radviz-t algorithm are discussed in detail.